
In 2010 the total number of electric EVs worldwide was 17.000 vehicles. Currently the stock of electric vehicles (EVs) exceeds 7.2 million vehicles with a significant percentage of them in China (47%).
In a global context of contraction of vehicle sales, and taking into account that subsidies for the purchase of EVs are decreasing in China and the United States, even so, the EV sector increased its sales in 2019 by 6% with respect to the previous year, with sales of 2.1 million vehicles (see Fig. 1).
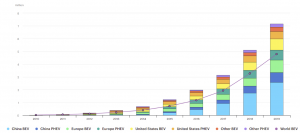
Fig. 1 Electric Vehicle and Plug-in Hybrid EV sales around the world.
Currently, EV sales represent 2.6% of global vehicle sales, this percentage rises to 4.9% in China and 3.5% in Europe. The current stock of EVs in relation to total vehicles is around 1% and the prospects for EV sales indicate a reduction in the growth rate of vehicle sales. Even in these circumstances, as it can be seen in Fig. 2, EV sales in 2040 are expected to represent almost 60% of total vehicle sales, touching a total of 60 million EVs. In this context, the design of strategies by the main vehicle manufacturers to position themselves in the EV market and offer to their clients a wide range of services that go beyond the vehicle itself is clear. To name a few examples, implementation of smart charging systems, V1G strategies that allow vehicles to participate in implicit demand response programmes, implementation of V2G technologies, integration of the vehicle at a network and housing level, combination at a network and housing level of the use of the EV with possible coordinated use of second life batteries, etc.
A critical task for the EV expansion is the development of a recharging infrastructure network that can provide a service to all users. To this end, it is necessary to know the habits and routines of the users so that the charging of vehicles is facilitated and the change from a conventional vehicle to an EV one does not entail a loss of comfort for the user. In this sense, it must be said that most of the charging of current EVs is carried out at home or at work using slow type chargers. In 2019, the global number of chargers exceeded 7.3 million, of which 6.5 million are slow chargers at home in individual or multi-dwelling buildings or chargers in workplaces. 37% of slow chargers are in China, 24% in US and in Europe, countries like Germany, France, UK, Norway, Netherlands are leading the slow charging infrastructure deployment with around 5% of world slow chargers in each country, the five of them concentrate 23% of all slow chargers in the world.
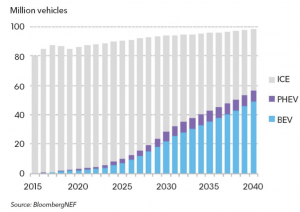
Fig. 2. Global long-term passenger vehicle sales by drivetrain
With regard to the deployment of public access charging points, only 12% of the currently deployed charging infrastructure is of this type with a total of 860,000 points deployed worldwide, of which 598,000 are slow charging and only 262,000 are fast charging. Of all this public access charging infrastructure, China accounts for 52% of the slow chargers and 82% of the public access fast charging infrastructure. At European level, the Netherlands is leading the way in the installation of public charging infrastructure with 8% of the slow charging infrastructure, followed by France with 5%, the UK with 4% and Germany with 3%. The figures for fast charging public access infrastructure at European level are much more modest at less than 10%. It is not unreasonable to deduce from these figures that demand response programmes that focus on the management of slow chargers installed in homes and workplaces will have the greatest impact on the network and will reach the greatest number of users in the medium term.
When designing demand response programmes and other policies to integrate electric mobility into the distribution network, it is necessary to put into context the figures in terms of power and energy that electric vehicles may represent in the medium term. To this end, the Global EV Outlook 2020 report [10] has designed two scenarios for 2030. The first of these is labelled Stated Policies and is an extrapolation to 2030, taking into account that existing policies are being maintained; it is the most pessimistic scenario in terms of EV penetration. The second scenario, called Sustainable Development Scenario, is the one which assumes that the objectives of the Paris agreement are met in accordance with the EV30@30 campaign. In the pessimistic scenario, it is estimated that the worldwide electric vehicle fleet will be 140 million in 2030, 33 million of which will be in the European Union. In the optimistic scenario the number of EVs worldwide in 2030 is estimated at 245 million, of which 44 million would be in the European Union. As can be seen in Fig. 3, the pessimistic scenario assumes a global annual energy demand of 550TWh while in the case of the optimistic scenario this demand would reach 1 000TWh, in this case demand at European level would reach 180TWh. To put these energy figures into context, we could say, for example, that electricity generation in Spain in 2019 has been approximately 250TWh and at a global level for the entire European Union, total energy generation in 2019 is around 3 000TWh. This means that in the optimistic scenario for 2030, the global demand for electrical energy necessary to supply electric vehicles would be more than 1/3 of the electrical energy generated in the EU-28 in 2019, and of this demand, that which is concentrated in Europe would represent 72% of the electrical energy generated in Spain in 2019.
With regard to on-board vehicle accumulation systems, the average capacity in 2018 was 37kWh, this average increased to 44kWh in 2019 and it is estimated that in 2030 this will increase to between 70 and 80kWh with a driving range estimated to exceed 400km. Analysing the driving habits of end users, we can see that the average user of a full EV in the European Union drives around 20,600km per year, with a daily average of around 56.5km. In the case of users of plug-in hybrid electric vehicles, annual driving in electric mode is around 5,600km with a daily average of 15.4km. This means that battery capacity is not a problem for average journeys, but it is a barrier to entry for EV technology, as users expect autonomy similar to that provided by internal combustion vehicles. It should be borne in mind that specific vehicles for urban shared use cannot be ruled out where battery capacity is tighter, but as a general rule we see that the increase in capacity is a global trend. The conclusion we can draw is that with electric vehicles with capacities exceeding 70kWh and taking into account the driving habits of users, the availability of electric energy in vehicle batteries to participate in demand response programmes will be very high.
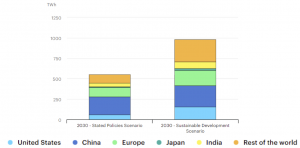
Fig 3. Total energy demanded in 2030 by the EVs according to the 2 scenarios proposed by the International Energy Agency.
The increase in vehicle battery capacity is mainly due to two factors. The first, as mentioned above, has to do with the expectations of end customers. Obviously, this is accompanied by a reduction in the price of the technology. Fig. 4 presents a very complete set of data which serves to give us an idea of the forecasts for the deployment of accumulation systems in the network and the cost of this technology according to two learning rates. Starting from a 2015 scenario in which the installed capacity of batteries at a global level is 40GWh, the price of the kWh obtained from a battery, taking into account the price of the battery, its amortisation period and the price for charging energy, was situated in 2015 at 0.25 dollars/kWh, a price higher than the cost of the kWh obtained from the network in most European countries. Although in countries such as Denmark and Germany the average price of energy from the grid for an end user exceeds 30 eurocents/kWh, in many countries this price does not exceed 15 eurocents/kWh. However, if we look at Fig. 4 we see that the forecasts for 2038 estimate a cost of kWh extracted from a battery of around 3 eurocents/kWh with a cumulative storage capacity of more than 80TWh. A very significant percentage (over 70%) of this capacity is estimated to be installed in electric vehicles.
As a curiosity, it should be pointed out that assuming that all the batteries were at 100% charge at a given moment in 2015, they could supply the global demand for energy for less than a minute. In 2038, carrying out the same study, forecasts indicate that the energy stored in all batteries deployed worldwide could supply the world’s energy demand for 1 day.
The conclusions are clear and groundbreaking. We have focused on electric vehicles, but their increased penetration is accompanied by other technologies such as heat pumps, home storage systems, increased distributed generation, etc. Without doubt, maintaining the balance between generation and demand without triggering investment in generation capacity and network expansion will be a complicated task for which the European Union is already legislating.
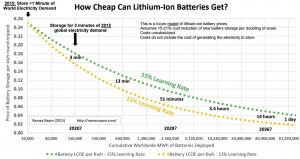
Fig. 4. Price/Capacity of Lithium-Ion Technology depending on the learning rate.
According to the international energy agency, the uncoordinated charge of vehicles could mean global peak hour increases of more than 10%, implementing demand response programs that affect vehicles is a critical task to reduce this percentage. On the other hand, assuming a storage capacity in vehicles of around 15-30TWh in 2030, and that only 5% of users are willing to participate in V2G-type programmes, this would mean having a worldwide capacity of between 600 and 1200GW of flexible power to manage (the installed generation power at the level of the European Union of 28 is just over 1000GW).
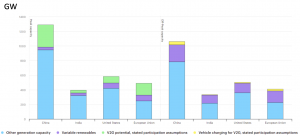
Fig. 5. V2G supporting the grid in peak hours potential in 2030 (left) and impact of the V2G vehicles in the grid during the off-peak hours (right).
With these numbers, and if we look at the graph in Fig. 5, we can see that the possible contribution of vehicles making V2G to the system during peak hours in 2030 is represented on the left (always assuming that only 5% of users are willing to participate in these programmes). In Europe, almost 1/3 of the peak hour power could be supplied by electric vehicles doing V2G. In the right side of the graph, we can see in yellow the impact that returning the energy injected by the vehicles into the grid during peak hours using V2G techniques would have on the system, and as can be seen this impact is very small.
[1] International Energy Agency (2020), Global EV Outlook 2020, IEA, Paris
[2] Transport & Environment Publications, “Recharge EU: How many charge points will EU countries need by 2030”, January 2020
[3] BloombergNEF, Electric Vehicle Outlook 2020
[4] Ramez Naam, “How cheap can energy storage get?” https://rameznaam.com/2015/10/14/how-cheap-can-energy-storage-get/


